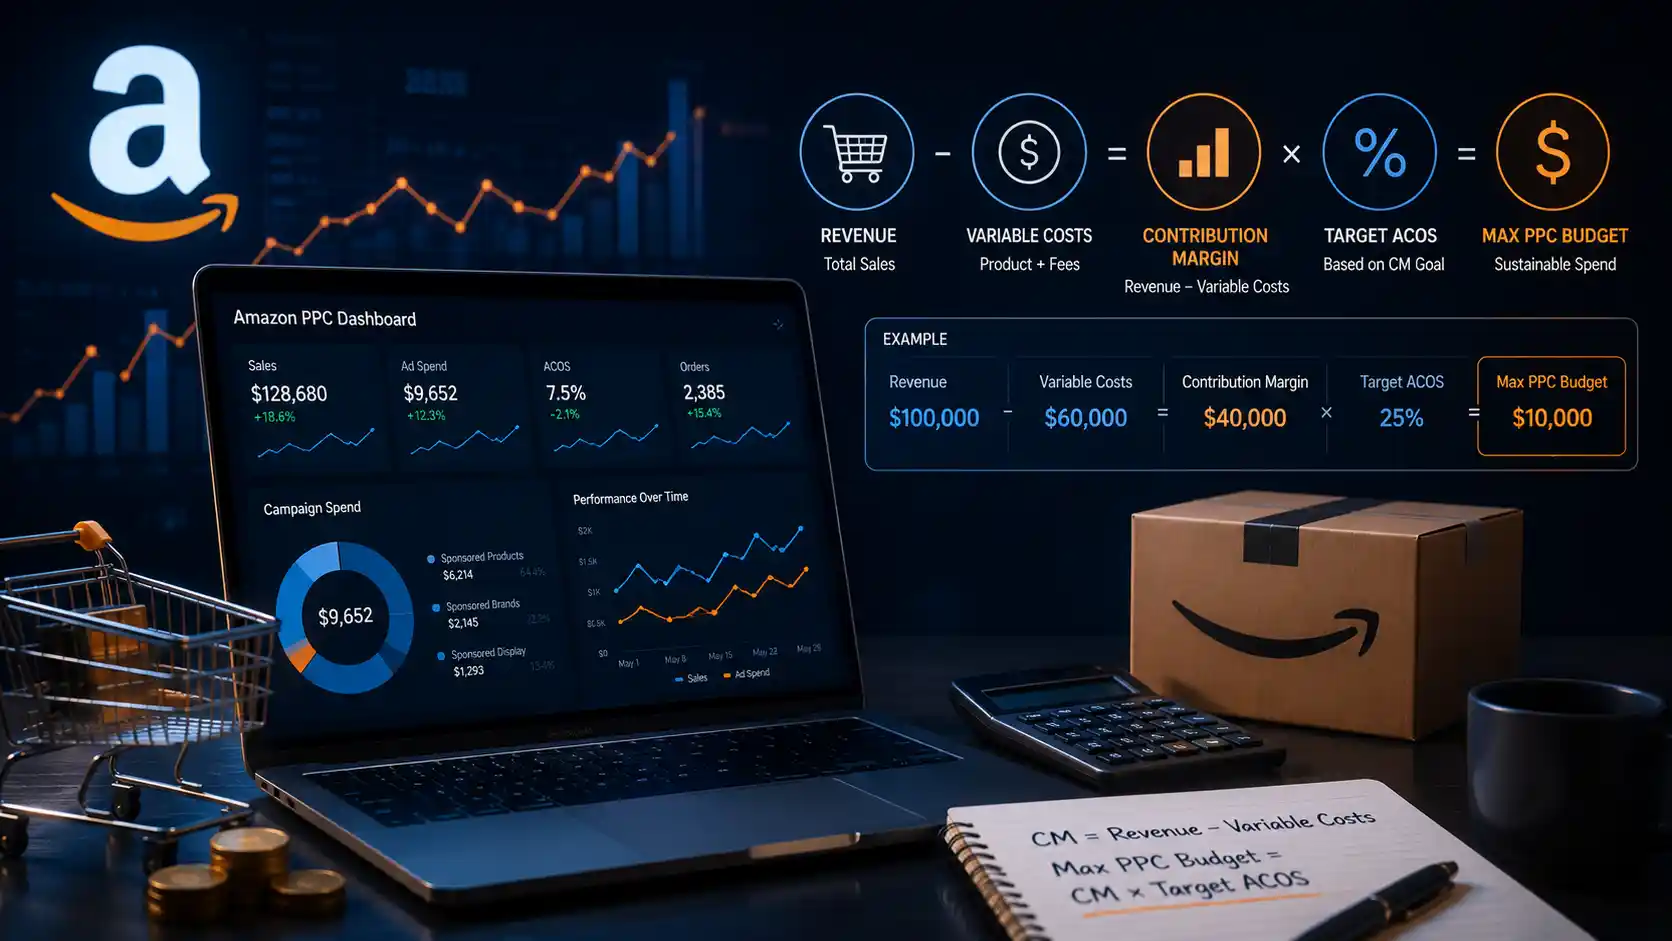
Summary:
“Most Amazon sellers pick a daily ad budget based on guesswork. This guide breaks down how to calculate your exact PPC budget using real contribution margins, organic sales ratios, and inventory limits to ensure every ad dollar drives actual profit.”
Most Amazon PPC guides offer the same generic advice: “Set aside 10% to 15% of your total revenue for ad spend.”
While that rule of thumb looks neat in a slide deck, it fails to account for real business variables. A product with a 45% gross margin can comfortably sustain aggressive advertising. A product constrained by a 15% margin will burn through cash at exactly that same rate.
Setting a sustainable amazon ppc budget requires abandoning arbitrary targets. Instead, top-performing brand managers construct their budget using contribution margin, break-even ACoS, organic sales ratio, and inventory velocity.
Here is a step-by-step framework to calculate, allocate, and optimize your Amazon ad spend for maximum net profitability.
1. What Is Contribution Margin (and Why Standard Revenue Percentages Fail)
Contribution margin represents the profit remaining from a single unit sale after deducting all variable costs—excluding advertising.
Contribution Margin ($) = Selling Price – (COGS + FBA Pick & Pack Fees + Amazon Referral Fees + Shipping & Prep Costs)
Contribution Margin Ratio (%) = (Contribution Margin ($) / Selling Price) * 100
Why Traditional Percentage Budgeting Breaks Down
When you pick an arbitrary daily budget (e.g., $100/day across all products), two issues occur:
- Underfunding High-Margin Winners: Products capable of eating market share safely are starved of budget.
- Overfunding Low-Margin SKUs: Products with tight margins run high ad spending, pushing your net cash flow into negative territory.
By anchoring your amazon advertising budget strategy to contribution margin, your pre-ad margin dictates your maximum bid and daily spend caps—ensuring you never pay more to acquire a customer than the product earns per unit.
2. Calculating Your Break-Even ACoS and Target TACoS
Before setting daily campaign budgets, you need two fundamental metrics: Break-Even ACoS and Target TACoS.
If you need help analyzing your account’s historical unit economics before configuring budgets, engaging a specialized Amazon PPC Management team can quickly surface hidden ad inefficiencies.
Step A: Break-Even ACoS Formula
Your Break-Even Advertising Cost of Sales (ACoS) is the point where ad spend consumes 100% of your pre-ad profit margin. At this point, you make $0 profit and lose $0.
Break-Even ACoS (%) = Pre-Ad Contribution Margin (%)
Step B: Target TACoS Formula
Because PPC drives both paid conversions and organic ranking (the flywheel effect), evaluating performance purely on ACoS can cause you to pull back spend prematurely. You must measure TACoS (Total Advertising Cost of Sales):
TACoS (%) = (Total Ad Spend / Total Brand Revenue) * 100
Reference Table: Unit Economics & Target Benchmarks
| Product SKU Profile | Retail Price | Variable Costs (COGS + Fees) | Contribution Margin ($) | Pre-Ad Margin (%) | Break-Even ACoS | Target ACoS (Profitable) | Target TACoS |
| SKU A (High Margin) | $40.00 | $20.00 | $20.00 | 50.0% | 50.0% | 30.0%–35.0% | 8.0%–12.0% |
| SKU B (Standard) | $25.00 | $16.25 | $8.75 | 35.0% | 35.0% | 20.0%–25.0% | 7.0%–10.0% |
| SKU C (Low Margin) | $15.00 | $12.00 | $3.00 | 20.0% | 20.0% | 10.0%–12.0% | 4.0%–6.0% |
3. The Math: Step-by-Step Daily Budget Formula
Once you know your target TACoS and projected sales volume, you can establish an accurate amazon ppc daily budget across your catalog.
The Core Formula
Recommended Daily Budget = (Target Monthly Revenue * Target TACoS) / 30
Real-World Example
- Target Monthly Revenue: $50,000
- Pre-Ad Contribution Margin: 32% (Break-Even ACoS = 32%)
- Growth Goal: Sustained profitability with moderate expansion
- Target TACoS: 10%
Monthly PPC Budget = $50,000 * 0.10 = $5,000
Daily PPC Budget = $5,000 / 30 = $166.67 / day
Adjusting for the Organic Sales Ratio
The ratio of paid sales versus organic sales directly dictates how aggressively you can fund PPC without breaching your target TACoS:
Max Sustainable ACoS = Target TACoS / PPC Sales Ratio
- If 50% of your sales come from PPC (0.50 ratio) and your target TACoS is 10%, your target campaign ACoS is:10% / 0.50 = 20% ACoS
- If your organic engine improves and PPC accounts for only 25% of sales (0.25 ratio), your target campaign ACoS can expand to:10% / 0.25 = 40% ACoS(allowing for higher, more aggressive keyword bids while keeping overall brand health intact).
4. Amazon Campaign Budget Allocation Matrix
Establishing a master daily budget is only half the equation; you must also distribute those funds effectively across campaign types. Conducting a thorough Listing and PPC Audit will help clarify whether your ad dollars are currently over-indexed in low-converting campaigns.
Budget Distribution Framework
- Sponsored Products (60% Total Budget): Exact Match, Broad/Phrase, Auto campaigns.
- Sponsored Brands & Video (25% Total Budget): Top of Search & Share of Voice domination.
- Sponsored Display & Retargeting (15% Total Budget): Defensive & Audience Capture.
Breakdown by Match Type & Campaign Intent (Sponsored Products)
- 50%: High-Intent Exact Match Keywords (Core Ranking)
- 30%: Research & Discovery (Broad, Phrase, Auto)
- 20%: Product Targeting / ASIN Defense (Competitor & Own Listings)
Campaign Budget Allocation Breakdown
| Campaign Category | Target Share of Budget | Campaign Objectives | Primary Metric Monitored |
| SP Exact Match (Core) | 30% – 35% | Rank maintenance, high-converting keyword defense | Exact Match ACoS vs. Break-Even |
| SP Broad / Phrase / Auto | 15% – 20% | Keyword discovery, long-tail harvest | Conversion Rate (CVR), Search Terms |
| SP ASIN Defense & Attack | 10% – 15% | Protecting cross-sells, capturing competitor traffic | Cross-sell conversion, CTR |
| Sponsored Brands & Video | 20% – 25% | Mobile SERP domination, high-CTR visual capture | Click-Through Rate (CTR), New-to-Brand |
| Sponsored Display Retargeting | 10% – 15% | View/Purchase retargeting, defense against poaching | Return on Ad Spend (ROAS), Impression Share |
5. Adjusting Budget Strategy for Inventory & Lifecycle Stages
A fixed budget formula applied blindly will fail if your inventory status or product maturity changes. Amazon ppc budget optimization requires dynamic shifts based on product life cycles and stock constraints.
A. Lifecycle Stage Budget Allocation
- Launch Phase (Months 1–3):
- Budget: 70% to 100%+ of Contribution Margin allocated to PPC.
- Goal: Maximize sales velocity to establish keyword indexing and Best Sellers Rank (BSR).
- Target TACoS: 25% – 40%.
- Growth Phase (Months 4–6):
- Budget: 30% to 50% of Contribution Margin allocated to PPC.
- Goal: Transition sales mix toward organic revenue while expanding long-tail targets.
- Target TACoS: 12% – 18%.
- Maturity Phase (Month 7+):
- Budget: 15% to 25% of Contribution Margin allocated to PPC.
- Goal: Maximize bottom-line cash flow and defend branded terms.
- Target TACoS: 6% – 10%.
B. Inventory-Aware Budget Scaling
Running aggressive PPC when inventory levels are low is one of the fastest ways to destroy rank and profitability. Integrating robust Supply Chain Forecasting practices into your marketing workflows prevents wasted spend when stock levels dip.
Use the following operational rules to protect your inventory health:
- Stock Level > 45 Days (Healthy): Execute 100% of planned PPC budget.
- Stock Level 21 – 45 Days (Warning): Reduce auto and broad discovery campaign budgets by 30%. Lower bids slightly to slow velocity while preserving conversion efficiency.
- Stock Level < 20 Days (Critical): Pause generic non-branded campaigns immediately. Maintain only branded defense campaigns at minimal spend to avoid stocking out before replenishment arrives. Stocking out completely causes severe loss of BSR rank that costs significantly more to rebuild.
6. Real-World Execution: Optimization Framework
To keep your daily ad spend aligned with your contribution margin, follow this weekly optimization cadence:
Weekly Optimization Steps:
- Calculate Realized TACoS:Formula: (Total Ad Spend / Total Sales)
- If TACoS > Target TACoS: Lower bids on keywords exceeding Break-Even ACoS.
- If TACoS < Target TACoS: Reallocate unused budget to top-converting Exact terms.
- Check Inventory Days of Supply (DOI):
- If DOI < 25 Days: Throttle Discovery & Auto campaign budgets.
- If DOI > 45 Days: Maintain or scale profitable Top-of-Search budgets.
Actionable Checkpoints:
- Pull the Last 14 Days of Sales & Spend Data: Exclude the most recent 48 hours to account for attribution lag.
- Evaluate TACoS against your Target TACoS:
- If TACoS is higher than target, reduce bids on terms running above your Break-Even ACoS. Do not cut daily budgets blindly; lower bids to reduce CPCs first.
- If TACoS is lower than target and inventory is healthy, reallocate budget to exact-match campaigns capped by daily budget limits.
- Audit Daily Budget Cap Depletion: Identify high-performing campaigns hitting daily caps early in the day (e.g., 2:00 PM EST). Shift budget away from low-performing auto/display targets to keep high-intent campaigns live through peak evening shopping hours.
Final Thoughts
Setting a sustainable Amazon PPC budget is not about guessing a random percentage of revenue. By grounding your ad spend in product contribution margin, setting strict break-even ACoS thresholds, and adjusting caps dynamically for inventory velocity, you transform Amazon PPC from an unpredictable expense into a profitable growth engine.
Calculate your unit economics first, assign campaign budgets by strategic intent, and scale spend only as your sales velocity and inventory allow.