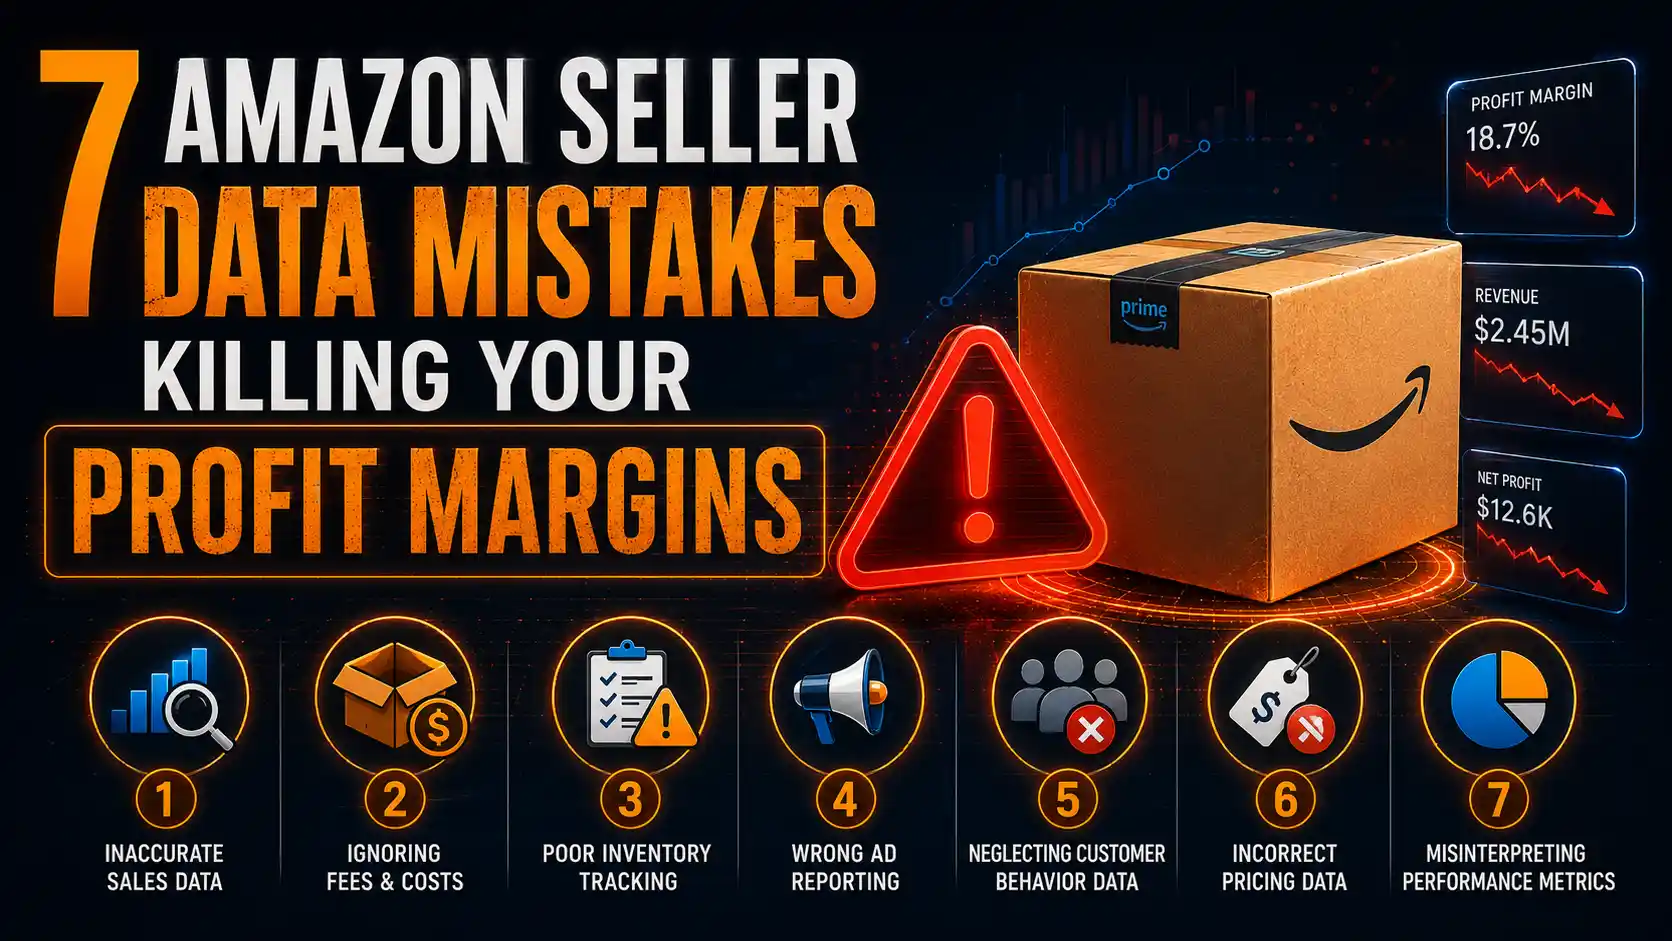
Running a successful business on Amazon has evolved far beyond finding a trendy product, sourcing it from a supplier, and launching basic ad campaigns. Today, Amazon is a hyper-competitive, algorithmic marketplace driven almost entirely by complex data sets.
Yet, many brand owners and media buyers unknowingly make critical amazon seller data mistakes every day. They log into Amazon Seller Central, look at high-level summary metrics, and make sweeping operational and advertising decisions based on incomplete or misunderstood numbers.
When you misinterpret your metrics, you aren’t just losing money on wasted ad spend—you are actively crippling your product’s organic ranking momentum, misallocating inventory, and bleeding cash flow.
The 7 Fatal Amazon Seller Data Mistakes
[ Surface-Level Revenue & Low ACoS ]  <-- False Sense of Security
                  │
                  ▼ (Ignoring Data Attribution & Fees)
                  │
[ Hidden Cash Leakage & Margin Erosion ]  <-- The Real Reality
1. Optimizing Amazon PPC Campaigns on a 1-Day Attribution Window
One of the most frequent amazon analytics errors occurs when sellers open their advertising console in the morning and optimize bids based on yesterday’s sales numbers.
When a shopper clicks on your Sponsored Products ad, they rarely purchase instantly. Many add the item to their cart, compare competitors, or wait a few days to complete checkout.
Why 1-Day Data Is Misleading
- Sponsored Products Attribution: Amazon attributes sales back to the day the click occurred using a 7-day attribution window.
- Sponsored Brands & Display Attribution: These formats use a 14-day attribution window.
If you evaluate campaign performance after only 24 or 48 hours, Amazon’s reporting engine has not had enough time to log all conversion data. Bids cut or keywords paused due to a high 1-day ACoS often result in killing top-converting keywords prematurely.
Data Benchmark: Internal account analysis reveals that brand managers who make daily PPC bid adjustments based on 24-hour data windows inadvertently pause up to 23% of their long-term, high-converting search terms.
The Fix
Establish a strict rule for your media buyers: never make downward bid adjustments or negative keyword additions on ad data less than 7 to 10 days old. Allow the attribution lag to settle before deciding whether a keyword is truly unprofitable.
2. Tracking ACoS in Isolation Instead of TACoS
Focusing exclusively on Advertising Cost of Sales (ACoS) is a classic ecommerce data mistake. While ACoS measures the immediate efficiency of your ad campaigns ($\text{Ad Spend} / \text{Ad Sales}$), it completely ignores how advertising impacts your brand’s total flywheel momentum.
The Problem with Solely Relying on ACoS
If you demand that your PPC campaigns maintain an aggressive 15% target ACoS across the board, your team will likely bid only on branded terms or narrow, exact-match keywords. While your ad console will show a clean, low ACoS, your total category share and organic sales volume will drop.
       ┌────────────────────────────────────────────────────────┐
       │             Total Ad Spend / Total Revenue             │
       └───────────────────────────┬────────────────────────────┘
                                   │
                 ┌─────────────────┴─────────────────┐
                 ▼                                   ▼
      High ACoS + Low TACoS             Low ACoS + High TACoS
   (Profitable Organic Rank Engine)    (Stagnant/Declining Growth)
The Fix
Track Total Advertising Cost of Sales (TACoS) alongside ACoS:
TACoS = [ Total Ad Spend / Total Revenue (Ad Sales + Organic Sales) ] × 100
A high ACoS (e.g., 45%) on a non-branded discovery campaign is completely acceptable if your overall TACoS stays healthy at 8% to 12% and your organic keyword ranking improves over time.
3. Ignoring SKU-Level Contribution Margins (The “Blended Profit” Trap)
Evaluating profitability solely at the total account level hides underperforming SKUs. An overall 18% net margin across your entire account can easily conceal one hero product carrying three low-margin SKUs that lose money every month.
What Missing SKU-Level Reporting Looks Like
Standard Amazon seller reporting often groups fees, returns, and ad spend into generic line items. This creates massive blind spots around:
- FBA Small & Light vs. Standard Tier shifts: Dimensional weight changes unexpectedly pushing a product into a higher fee bracket.
- ASIN-specific return fees and disposal costs: Certain product variations experiencing high return rates that destroy margins.
- SKU-level ad spend spend-outs: A secondary variation quietly consuming 40% of a campaign’s budget without converting.
The Fix
Build a dedicated SKU-level P&L matrix. Calculate the exact Contribution Margin for every single ASIN using this formula:
Gross Revenue – (COGS + FBA Referral Fees + FBA Fulfillment Fees + Storage Fees + Direct PPC Spend) = Contribution Margin
If an ASIN yields a contribution margin below 15% after ad spend, restructure its advertising or adjust its pricing strategy immediately.
4. Misinterpreting Amazon Search Query Performance (SQP) Data
When Amazon introduced Search Query Performance (SQP) within Brand Analytics, it gave brand owners access to actual query-level volume, impression share, click share, and purchase share. However, misreading this data leads to severe budget misallocations.
The Misinterpretation
Sellers frequently see a high search volume term in their SQP dashboard where their brand holds a 20% Impression Share, and immediately pump thousands of dollars into exact-match PPC campaigns for that term.
However, if your Purchase Share on that same query is only 2%, throwing more ad dollars at the keyword will not fix the underlying issue.
High Impression Share + Low Purchase Share = Listing Issue (Price, Reviews, Creative)
High Impression Share + High Purchase Share = Proven Winner (Scale Ad Spend Here)
The Fix
Use SQP data as a diagnostic tool rather than just a keyword target list:
- High Impression Share + Low Click Share: Your main image, price point, or review rating is uncompetitive compared to category peers.
- High Click Share + Low Purchase Share: Your detail page listing copy, A+ Content, or bullet points fail to convert visitors into buyers.
5. Allowing Branded Keyword PPC Traffic to Obscure Unbranded Performance
Branded keywords (queries containing your specific brand or trademarked product name) naturally convert at an extremely high rate and low cost.
How Branded Terms Skew Your Amazon PPC Data Analysis
If you run blended campaigns where branded keywords sit inside the same campaign or portfolio as unbranded category terms (e.g., “ScribeMedix Ergonomic Chair” mixed with “ergonomic office chair”), your overall metrics will look artificially healthy.
Your campaign might show an attractive 18% ACoS, but upon closer inspection, 85% of the sales came from shoppers who were already searching for your brand name. Meanwhile, your unbranded conquesting terms are burning budget at a 90% ACoS without driving new customer acquisition.
The Fix
Segment your account structure completely:
- Branded Campaigns: Isolate all brand-name search terms into dedicated campaigns with restricted budgets designed purely to defend your top-of-search placement.
- Non-Branded Campaigns: Group discovery, competitor, and broad category terms into separate structures. Measure growth based on net-new market acquisition rather than low-hanging brand searches.
6. Failing to Account for Storage Fees, Multi-Channel Fulfillments, and Hidden Refunds
When executing amazon seller reporting, focusing only on ad spend and gross sales leaves out critical backend line items that directly cut into operating profits.
Hidden Cost Leaks
- Aged Inventory Surcharges: Units sitting in FBA warehouses past 180+ days incur steep monthly storage penalties.
- Unreturned Customer Refunds: Amazon refunds a buyer upon request, but if the item is never returned to the FBA warehouse within 45 days, the reimbursement credit can take months to process or slip through the cracks entirely.
- Inbound Placement Fees: Changes to Amazon’s FBA inventory placement fee structures mean shipping inventory to a single location incurs higher backend fees than splitting shipments.
The Fix
Audit your monthly Date Range Reports inside Seller Central line-by-line rather than relying solely on high-level dashboard graphics. Match your physical inventory turn rates against storage fee brackets every 30 days to avoid long-term holding penalties.
7. Over-Relying on Automatic Campaigns Without Regular Negative Keyword Harvesting
Auto campaigns are valuable tools for keyword discovery, but letting them run without active management turns them into significant profit drains.
The Trap of Unmonitored Auto Campaigns
Amazon’s algorithm tests your product across broad, loosely related product searches (Complements, Substitutes, Loose Match, Close Match). Over time, auto campaigns begin spending budget on irrelevantly broad queries, misspellings, or competitor ASINs that generate zero sales.
The Fix
Establish a weekly Negative Keyword Harvesting routine:
- Pull your 30-day Search Term Report.
- Filter for search terms or target ASINs with more than 8–10 clicks and $0 in sales.
- Add these terms as Negative Exact or Negative Phrase match types across all auto and broad-match manual campaigns.
Strategic Frameworks: Solving Your Amazon Analytics Errors
Why Do Traditional E-Commerce Data Analytics Fail on Amazon?
Many brand owners entering Amazon from Shopify or DTC backgrounds attempt to apply traditional web analytics strategies to Seller Central. This approach consistently fails due to fundamental differences in how the platforms operate.
┌─────────────────────────────────────────────────────────┐
│               Traditional E-Commerce (Shopify)           │
│  • Immediate conversion tracking                         │
│  • Direct Google/Meta ad attribution                    │
│  • Siloed revenue analytics                             │
└────────────────────────────┬────────────────────────────┘
                             │
                             ▼
┌─────────────────────────────────────────────────────────┐
│                 Amazon Algorithmic Flywheel              │
│  • Delayed 7-to-14 day ad attribution windows            │
│  • Organic placement tied directly to ad conversion velocity│
│  • Complex FBA storage tiers & fluctuating buy box rules │
└─────────────────────────────────────────────────────────┘
Traditional e-commerce platforms evaluate advertising as a isolated acquisition channel. On Amazon, however, advertising is directly tied to the Amazon Flywheel:
- Ad sales increase overall unit velocity.
- Increased unit velocity boosts organic keyword ranking.
- Higher organic ranking drives organic sales, lowering overall acquisition costs.
Evaluating Amazon data purely as isolated marketing spend overlooks these interconnected algorithmic relationships.
How Should Sellers Conduct a Proper Amazon PPC Data Audit?
If you suspect your ad spend is being wasted due to poor reporting structure, follow this step-by-step diagnostic process:
Step 1: Isolate Attribution Lag
Download your last 60 days of Sponsored Products reports. Compare performance metrics from 14 days ago against metrics from the last 48 hours to determine your account’s exact conversion delay.
Step 2: Calculate True TACoS Across All Portfolios
Map out your ad spend relative to total revenue over a rolling 90-day period. Identify whether rises in ad spend correspond with organic rank increases or simply represent increased ad costs for the same sales volume.
Step 3: Run Search Term Waste Audits
Filter bulk sheets for terms with high spend and zero conversions over 30–60 days. Immediately isolate non-performing terms to free up working ad capital.
Expert Take:
“The most dangerous Amazon seller data mistake isn’t losing money on bad keywords it’s killing winning campaigns because you evaluated attribution data before the 14-day conversion cycle closed.”
— Data Strategy Team, Advertising Spire
If managing complex bulk sheets and calculating true SKU contribution margins feels overwhelming, you can request a professional, deep-dive PPC Audit to uncover hidden ad waste and structural opportunities across your account.
When Is the Right Time to Pivot Your Amazon Data Strategy?
Data monitoring must be ongoing, but specific performance triggers require an immediate strategic pivot:
- Trigger 1: TACoS climbs by more than 3% over 30 days without organic ranking gains.Action: Pause unbranded discovery spend and audit listing conversion factors (pricing, creative assets, review volume).
- Trigger 2: Top-performing keywords show dropping Purchase Share in Search Query Performance.Action: Check for competitor price adjustments, loss of the Buy Box, or new negative reviews on your listing.
- Trigger 3: Contribution Margin on core ASINs drops below 15%.Action: Re-evaluate inventory storage durations, optimize product packaging dimensions to reduce FBA tiers, and isolate PPC spend strictly to high-converting phrase/exact targets.
Scaling an Amazon brand past six or seven figures requires ongoing monitoring and precise budget execution. Partnering with dedicated experts for ongoing PPC Management ensures your ad spend is continually optimized using real, multi-attributed data rather than misleading dashboard metrics.
Action Plan: Fixing Your Amazon Reporting Strategy
Correcting these errors doesn’t require rebuilding your entire business overnight. Focus on these three immediate adjustments:
- Stop daily PPC bidding cuts: Allow a minimum 7-to-10 day window for conversion attribution to settle before modifying bids.
- Switch your core focus to TACoS: Focus on overall portfolio profitability rather than obsessing over individual campaign ACoS.
- Clean up your PPC campaign structure: Separate branded defense keywords from unbranded growth campaigns to see your true customer acquisition costs.
By replacing surface-level metrics with accurate, attributed data analysis, you can eliminate ad waste, protect your contribution margins, and build a sustainable engine for brand growth on Amazon.